
Low-balling and The Importance of Item Graphs when Flipping
Page 1 of 1

Low-balling and The Importance of Item Graphs when Flipping
![]() by [ADMIN] Billious 17/12/2013, 1:40 pm
by [ADMIN] Billious 17/12/2013, 1:40 pm

Low-balling and The Importance of Item Graphs when Flipping
Low-balling is quite simply the act of putting in a buy offer a fair amount lower than the price that an item is currently being traded at in the hopes that someone panic sells. The aim is to purchase an item for a cheap price overnight, allowing you to make a sale for great profits in the morning.
Items which are stable in price are constantly being traded around the same margins which means that it is unlikely to make a buy at a really low price which will profit you. Items which are rising are being traded above the GE price, this is what is pushing the price up. When an item is rising it is very, very hard to manage to pick up some of the item at a low enough price to make it work, without it automatically turning into a short-term investment.
So this leaves us with crashing items! I know some people freak out at the concept of flipping items while they are falling in price but honestly, through experience I can tell you that these items usually make the best flips, and when it comes to low-balling offer insane profits.
I’m going to use Third-Age equipment as an example here. Let’s say Third-Age melee is all crashing in price fairly steeply. When people notice this big drop in prices they begin to panic and what you often get is what I like to call “Panic-dumpers” who will throw their items in the GE for an instant sell right away in order to avoid greater losses. These are the items we are hoping to catch with our “Low-ball” offers and then go on to re-sell for a more realistic price closer to the true street price at the time. The key tricks behind Third-Age in particular is further explained in Google's Third age guide, but this is the key concept to grasp when you are looking to make low-ball offers.
http://www.smokinelite.com/t66655-google-s-third-age-flipping-guide-everything-you-need-to-know
Part 2 - The Importance of Item Graphs when Flipping
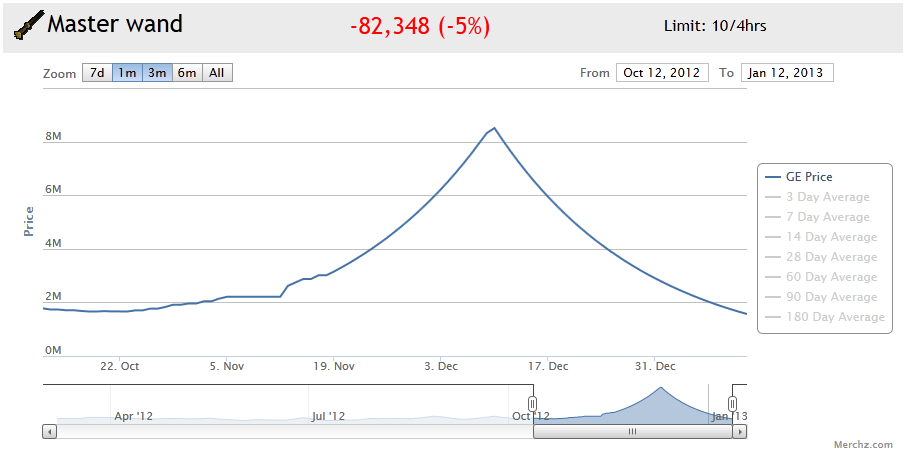
Graphs start to become a useful tool to use when your flips start taking more time. When overnight flipping it is often wise to check the items graph. The biggest mistake people make is to think it's safer to flip an item that is rising on the graph. Now without learning all the indicators that investors look for and fully understanding graphs, this is actually the most risky time to overnight an item. Sure if everything goes well, you wake up in the morning to a filled offer and find your sell price has risen, so you can make more than you first thought.
The problem is you may very well fill the buy offer, but because the item has been rising, the chances of it dropping on you increases. In this scenario you are stuck with an item you over payed for that has dropped below your buy price and will continue to drop for sometime before rising again. If you were to hold the item until you can break even, you could be stuck with your money tied up for months.

Stable graphs are a much safer option, but the thing is if an item is stable and doesn't go up or down very much, then margins tend to be small. Without much change in price, you can be pretty sure you won't get burned, but the small amount you are likely to make from flips like these doesn't justify wasting the limited GE space. If you can make more with that space why wouldn't you.
So that leaves falling graphs. While it can be scary to start flipping items that are dropping, they are actually easier to reduce the amount of risk in overnight flipping. The thing is knowing the item is falling means you can put a buy offer in for lower than your pc's low price. This opens up the chance to catch those who see the fall and panic sell their stock, while giving you a buffer in case it falls more than you expect. Because people tend to panic sell falling items, these items actually have bigger margins. After all it's not often people panic buy things.
When you put a buy offer in below your pc's low one of 3 things will happen. First the stock doesn't fall as much as you expect, in which case you get no stock and make/lose no money. This is not that bad a thing to happen since your in the same position as you started, but now you have a better idea of how the item falls in price. Armed with this knowledge you are more likely to get it right on your next try.
Second is you get some or all the stock you were trying to buy. Since this means the price has fallen since your pc, you should put your sell offer in for less than the pc's high price. As a general rule it should be somewhere around the halfway point of your previous pc's high and your actual buy price. Of course once you get practice doing this with each item you will get to know what sort of margin you can make and will just add this to your buy price.
Lastly you could have underestimated the amount the item fell. This mistake may cost you, so it is better to overestimate how much an item will fall until you have successfully done it with that item a few times. But since you bought below the original low price you have softened the blow some. If this happens you should try to sell at or slightly above your buy price. If you bought at this price, chances are someone else might too. However if none sell after maybe an hour or so lower your price slightly in an attempt to get out with the smallest loss possible.
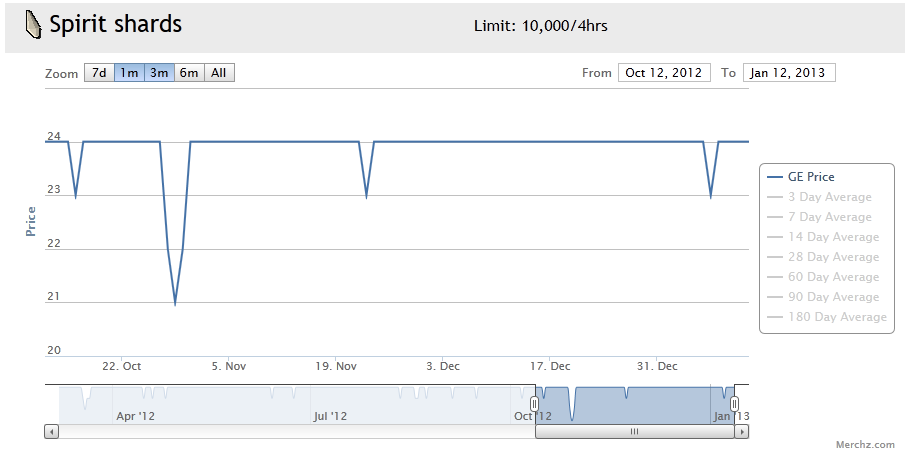
Now there is one type of graph that you will come across that can't just be taken as it is. While all graphs are basically old news, being made from yesterdays trades averaged against the previous ge price, "Step" graphs can be older. Treasure trail items often have step graphs and this is caused by their low volume of trades. An unknown amount of trades needs to occur before the ge will create a new average and so items with low volume (small amounts of stock traded each day) may take 2, 3, 4 days or even months before a new average or ge price is created. On graphs this appears as a flat section followed by a rise or fall, then followed by another flat spot and so on, making it look like steps.

For the most part these can't be trusted on their own, but when you look at the ge price compared to a pc you should have enough information to know if the item is rising or falling. If both the high and low price from your pc are below the ge price then the item is falling in price. If both the high and low price from your pc are higher than the ge price then the item is rising. If the low is below the ge price and the high is above it, then the item is either stable or in the middle of changing direction. Basically its best to leave these items until you have more information on what it's doing. By using this method and looking at the graph you gain more information on the item and whats likely to happen next and are therefore more likely to succeed with your overnight flips.
Special Thanks to Google and the flipping mentor team who helped make this guide Cille, Gonecase, Kelly, Killerhart and Minato.
![[ADMIN] Billious](https://2img.net/u/1313/35/50/68/avatars/57990-92.jpg)
[ADMIN] Billious- Administrator

» Reziony's Huge Flipping Item List [F2P & P2P]
» Active flipping an item without a Price Check
» Reading Graphs
» Road To 500m Flipping! <3 - With Updated Flipping Logs All The Time
» [Flipping Graduate] Werkverkeers Flipping Log [125m+ profit]
» Active flipping an item without a Price Check
» Reading Graphs
» Road To 500m Flipping! <3 - With Updated Flipping Logs All The Time
» [Flipping Graduate] Werkverkeers Flipping Log [125m+ profit]
Page 1 of 1
Permissions in this forum:
You cannot reply to topics in this forum|
|
|